
Investors wondering why the stock market continues to rise as we face the worst economic conditions since the Great Depression need only look at the Federal Reserve’s balance sheet, which has increased in size by $3 trillion since February.
That represents printed money which the Fed is using to purchase Treasury bonds, mortgage bonds, corporate bonds, and asset backed securities, which brings the total amount of printed money to $7 trillion. In doing so, they have driven bond yields down, which justifies a higher multiple for stocks.
This is currently the only reason for a rising stock market. Markets have become completely divorced from reality, and stocks in particular are ignoring the galloping pace of Covid-19 spread or the 239 scientists from 30 countries urging the WHO to accept that the virus is airborne, and maybe carried indoors for tens of meters. It took the U.S. 99 days to reach one million cases, 43 days to get to 2 million and 28 days to add another million.
Never before has a divorce between economic data and risk been so pronounced, and never have we been in this situation before. Aside from an explosion in the number of COVID-19 cases (which are forcing many states to reconsider the wisdom of re-opening their economies), the “big four“ economic indicators are, in a word, grim:
• US personal income is down 6% when adjusted for inflation. This number excludes transfer receipts, meaning that it strips out all of the temporary government assistance especially from the CARES Act of March 27th.
• Industrial production is down 17% this year.
• The Bureau of Labor Statistics puts unemployment now at 11.1%. There are some questions about this statistic, because of methodology errors that the BLS itself has admitted to. The real unemployment figure could be considerably higher.
• Real (inflation adjusted) retail sales are down some 7.5% on the year.
Beyond those, consumer confidence is down 23.5%, new residential construction is down 23.2% year-on-year in May.
This litany of bad news gets worse with each new Covid-19 case, and the same applies with most international markets. (The European Union projects an 8.3% contraction this year). First quarter U.S. GDP shrank by 5%, and second quarter GDP, to be officially released on July 30th, is anticipated to drop by 52.8%, according to the Atlanta Federal Reserve.
And yet, the stock market remains frothy due to Fed stimulus. The forward price to earnings multiple of the S&P 500 is currently at 21.3 times, which is approaching the most expensive levels of the dot-com bubble. As indicated in the chart below, the stock market has been correlating closely to the Federal Reserve’s balance sheet:

It should be noted that the performance of the S&P 500 is being carried by around 6 stocks, which are also among the largest companies, some of which have actually benefitted from the COVID-19 crisis. If the S&P 500 were measured on an equal-weight basis, as opposed to a market capitalization weighting, it would be down around 16% YTD. FAANG stocks plus Microsoft give us nearly one-fourth of the value of the entire S&P 500. According to data provider FactSet, Wall Street analysts are anticipating a drop of 21.5% in earnings of the S&P 500 companies in 2019, and a drop of 3.9 per cent in revenues. For next year, their estimates are (perhaps wildly) optimistic, anticipating a rise in profits of 28.2%, and a rise in revenues of 8.5%.
In the most recent Fed announcement, it was indicated that going forward, it will be buying $80 billion in Treasury bonds per month, which is far from the $75 billion per day they were buying from March 19 until April 1.
This week, the Head of the New York Fed’s market group said that “if market conditions continue to improve, Fed purchases could slow further, potentially reaching very low levels or stopping entirely.“ If that happens, the support we have seen for stocks will begin to fade. In fact the Fed’s balance sheet has been falling over the last few weeks, because of expiring swap lines it uses to lend dollars to foreign central banks. There is little understanding about why, when the Fed’s balance sheet begins to fall, so does the stock market. But it should be noted that $450 billion of the swap lines are expiring over the next six weeks which represents 6% of the Fed’s balance sheet. These can easily be extended, but in the same magnitude?
So when does the money run out? The Federal budget deficit of the United States is obscenely high, and hit a record $863 billion in June, a 100 fold increase from one year ago. US public debt exploded by $3 trillion in the past three months and now stands at $26.5 trillion overall, at the end of May. All of this is happening at a time when government tax receipts have shrunk so far this year by 8.3%.
This is clearly unsustainable, but the US is now addicted to stimulus.
In the current political environment, is it more likely that the US government will begin to pay back its debts, or diminish the value of that debt through inflation? Most likely the latter:
The following chart gives us the US money supply, which has increased by some 20% this year:

With more money and less goods and services being produced, we might assume that inflation will climb from a very low level. Certainly, if we think two years forward, cuts in production, investment, and productive capacity should lead to higher prices. Copper, gold, and steel prices are all now rising sharply which are bellwethers for inflation. Inflation is anticipatory and will begin rising before the deflationary effects of unemployment bottom out.
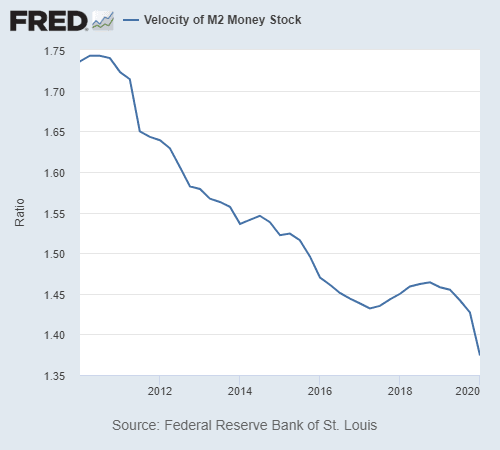
However, there is one variable which is holding inflation back, called “the velocity of money“ (see chart below). This measures the number of times an average unit of currency is used to purchase goods and services in a given time period. Currently, the market is beginning to price in inflation even when this figure has been in decline. When money velocity begins to turn up, or even stabilize, inflation will accelerate in earnest.
This will benefit gold, of course, which has been one of the better performing asset classes this year. Long-term TIPS (Treasury Inflation Protected Bonds) should also continue to benefit. TIPS have two components: a Treasury bond component and an inflation component. Usually, higher inflation means higher Treasury yields, so the price benefit of higher inflation on TIPS is canceled out by lower Treasury prices. But with the Fed promising to keep bond yields low for the coming two years, there is less downside risk for long dated Treasury bonds, and TIPS become more sensitive to pure inflation. However, there is still risk to this investment thesis. Despite the Fed’s assurances to support Treasury bond prices, if there is a U.S. Dollar rout, the Treasury bond market could be overwhelmed with sellers from abroad who fund the current account deficit.
The last chart represents the U.S. Dollar index, which is now declining:

The Fed has been providing an unlimited amount of Dollar supply, so the currency is declining relative to other currencies due to debasement. The current account deficit – around $50 billion per month – used to be overcome by foreign investors buying U.S. assets which had higher yields than abroad. Now, those yields have come down – a lot – and so outflows out of the dollar are occurring. If the dollar weakens further, this can also provoke outflows in the stock and bond markets.
Americans receiving unemployment benefits have been getting an extra $600-a-week federal supplement on top of their state jobless aid. That will expire after July 31. Businesses that received a loan through the Paycheck Protection Program may also be near to exhausting those funds. These loans were first made available to businesses in early April, and borrowers were initially required to spend the money within eight weeks in order to have the loan convert into a Federal grant which doesn’t need to be repaid. That requirement was recently changed to 24 weeks. Whether these programs are renewed remains to be seen.
Prediction and betting markets are pricing in that Democrats will control the White House, the Senate, and the House of Representatives by 62%, 61%, and 85%, respectively, compared with 43%, 30% and 61% in late February. The options market is predicting unusually high volatility just before and just after the elections, perhaps to reflect the fact that either it might take a few days to tally up the mail-in votes after November 11th, or that the outcome of the election will be contested. The current levels of the stock market seem to suggest that it is comfortable with that outcome, although healthcare stocks have been underperforming in anticipation of a Democratic Party sweep.
There is a strong likelihood of a second pandemic wave. In reality, there was never an end to the first wave, which is growing alarmingly. Combined with the over-valuation of stocks, the erratic behavior in the White House, the election uncertainty, and the knowledge that Federal stimulus cannot last without causing a rout in the U.S. dollar, risk should be pared accordingly out of risk asset, overweighting gold and TIPS.
The Dow fell 9.55% in the first half of the year, the S&P 500 was down 4.03%, and the Nasdaq gained 12.4%.
Grant Rogers

