Jul 16
Third Quarter Forecast and Opinion
This quarter the topics to highlight are inflation, the Iran war, the new Fed Chair, the rotation of the AI trade, and their effects globally.
The US unemployment rate is now at 4.2%, with a jobs market “treading water” that has only added a mere 92,000 so far this year. Healthcare and Social Services are responsible for all of that job growth since January 2025; remove this sector and the job market has actually been shrinking. This may be due to a sharp decline in immigration. GDP growth in the first quarter came in at 2.1%, down from 2.5% overall last year, and is forecast to be at 1.3% in the second quarter by the Atlanta Fed.
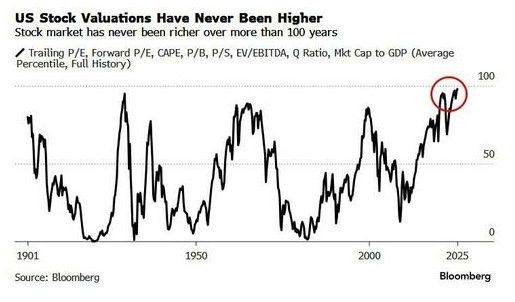
Renewed concerns that AI spending may be peaking have investors increasingly worried that hyperscalers may eventually slow the extraordinary pace of their AI infrastructure investment. Also, the semiconductor sector has been one of the market’s strongest performers, but has seen aggressive profit taking in recent days. Valuations in all AI related companies, and the stock market in general, remain elevated. Using an average of eight different methodologies, the stock market has never been this expensive in its history:
With respect to the “AI trade”, there are now measured prices for “tokens” representing AI usage. While the marginal willingness to pay for “frontier intelligence” had been climbing for months, it now appears to have stabilized, and may even be slightly declining. But first, let’s define what exactly “frontier intelligence” is. Frontier AI is AI operating at or near the current limits of what is technically possible, whereas conventional AI simply solves well defined tasks. Frontier AI requires more computing power, and therefore is more expensive to use. Companies are beginning to ration weekly token budgets to employees, because they are beginning to understand the nature of AI budgeting and its cost. Wall Street assumes that most AI demand will be driven by “frontier labs” like Open AI or Anthropic, but real competition may emerge from either Meta, or
Grok, or the Chinese DeepSeek, whose prices are anywhere between (roughly) 50% to 90% cheaper. So far, globally, we will have committed between $1.4-$1.6 trillion by the end of this year. Some Wall Street firms estimate that another staggering $7 trillion will be spent between 2026 and 2031. The question is whether AI profits will eventually justify this level of investment. The answer to that will take years to understand, but in simple terms, the question is whether $7 trillion is already built in to today’s Nasdaq multiples. Some would argue yes. Others would argue that the future profitability of AI is completely unknown.
On Friday July 11, China’s Ministry of Commerce issued an immediate ban on helium exports to secure domestic supply for critical sectors like semiconductor manufacturing and medical technology. This comes at a time when the Middle East conflict has just re-ignited and Qatar’s supply of one third of the world’s helium is under threat. There is no viable chemical alternative for helium in advanced manufacturing processes of semiconductors, which requires liquid helium to cool tools during high temperature steps. Signs of a tight helium market are already showing up in the spot helium market. A disturbance in the helium supply chain could disrupt the manufacturing of semiconductors which are critical to the AI trade.
The predominant themes of oil and inflation have been top of mind over the past quarter as the Iran war lingers. Crude oil cheapened up considerably as it seemed that the war was winding down and dipped as low as $67 a barrel in June. Hostilities have now recommenced and the Strait of Hormuz is once again closed, with crude back to $80. It would not be surprising to see crude oil back at $100 before long. The temporary dip had a favorable impact on the June inflation number, which came in at 3.5%, less than expected as energy prices eased.
The “Core PCE“, (Personal Consumption Expenditures) the Fed’s preferred measure of inflation, came in at 3.4% in May 2026. That is up from 2.78% a year ago, for a year-over-year increase of 0.6%. Some of that inflation is due to tariffs, but it is now more likely coming from shocks in the energy market and fiscal recklessness.
At the June 17 Federal Reserve meeting, nine Fed policy makers forecast interest rate hikes later this year; five of these were voting members.
Although it is not often discussed, there is still some skepticism in the bond market about Trump‘s choice to lead the Fed. This is due to the possibility that Kevin Warsh is a Trump appointee, and that Trump has very vocally stated that he wants lower interest rates. It should be noted that Warsh’s father-in-law, Ronald Lauder, has been close personal friends with Donald Trump for over 60 years and is a Trump mega-donor.
While committing to the Fed’s 2% inflation target, Warsh recently suggested revisiting the way the Fed measures inflation, and is considering using a new measure called the “Trimmed Mean PCE“, which cuts off “outlying” statistics. Under this new methodology, PCE inflation would be only 2.4% currently, only modestly above its 2% target. For investors, the implication are significant:
- Headline PCE (~4.1%) suggests inflation has reaccelerated sharply.
- Core PCE (~3.4%) suggests inflation remains stubborn.
- Trimmed Mean PCE (~2.4%) suggest that most of the recent acceleration is concentrated in a relatively small number of volatile categories and that inflation is actually quite close to the Fed’s goal.
Inflationary pressures over the past 90 days are not only due to oil, which is temporary, but to reckless government spending. Long-term debt levels have been pushing bond yields higher globally, as we confront a crossroads between debt, inflation, and populist governments refusing to cut spending to curry political favor amongst their voters. The US will have a deficit of 6.5% of GDP this year, the largest deficit ever outside of wartime and emergencies. This is the real problem worth paying attention to.
This is not just contained to the US. Japan, for example, is borrowing more to help consumers cover higher energy prices. In the UK year-to-date borrowing is up 23.9% year-on-year. UK interest payable was up 54.4% year-on-year in May. The current UK budget deficit is up 25.5% this year, worse than forecast. The UK 30-year bond is at its highest level in decades.
In France, the budget deficit is near crisis levels, forecast at 5.1% for 2026 and 5.7% in 2027. Public debt is now at 115.6% of GDP. The European commission expects that to hit 120% by 2027. Meanwhile, growth is weak (forecast at only 0.5%), too weak to “grow out of” the debt. Even Germany, whose fiscal deterioration is less extreme than the UK or France, is borrowing at an alarming rate. The EC forecast Germany’s debt-to-GDP ratio to rise from 63.5% in 2025 to 68% in 2027.
In all five cases, (the US, Japan, UK, France, and Germany), there is an absence of political will to deal with debt. There is also a sense that dealing with that debt will be politically costly to any parties in power.
When investors suddenly demand much higher yields because they lose confidence that a country’s fiscal path will stabilize, the bond market of that nation suffers, as do borrowers, who must pay higher interest rates. France and the UK are on that path. If deficits in the US remain near 6 - 8% of GDP during a period of full employment, long-term yields could continue rising and create significant fiscal pressure.
The bond market, for now, remains focused on rising inflation, but that could also be accompanied by concerns over rising Treasury bond supply. Because the bond market looks years ahead, the focus may pivot to treasury bond supply which looks to increase in order to continue to finance the ever-growing national debt.
In summation, the 4-year technology bull market is overstretched and is due for a pullback, particularly in AI, semiconductors, memory, and data centers. Consumer Staples, Healthcare, Midstream Energy companies (pipelines), and Waste/Environmental Services should be favored for their safety and ability to withstand a generalized pullback. The stock supply liberated from SpaceX “insiders” in the second half will be substantial (potentially up to approximately $119 billion with the stock at $131, with potentially another $59 billion available to sell out to December 9, assuming a $131 share price) and will represent selling pressure on the Nasdaq. Additionally, the Iran war represents upside risk to the price of oil, and the threat of higher interest rates represents risk to an overvalued stock market.
For the first half of 2026, the S&P 500 index was up 9.55%, the Dow was up 8.85%, and the Nasdaq was up 12.78%.
Grant Rogers
GLOBAL DISCLAIMER: THIS REPORT HAS BEEN PREPARED BY METIS CAPITAL MANAGEMENT LLC. THIS REPORT IS FOR DISTRIBUTION ONLY UNDER SUCH CIRCUMSTANCES AS MAY BE PERMITTED BY APPLICABLE LAW. IT HAS NO REGARD TO THE SPECIFIC INVESTMENT OBJECTIVES, FINANCIAL SITUATION OR PARTICULAR NEEDS OF ANY SPECIFIC RECIPIENT. IT IS PUBLISHED SOLELY FOR INFORMATIONAL PURPOSES AND IS NOT TO BE CONSTRUED AS A SOLICITATION OR AN OFFER TO BUY OR SELL ANY SECURITIES OR RELATED FINANCIAL INSTRUMENTS. NO REPRESENTATION OR WARRANTY, EITHER EXPRESS OR IMPLIED, IS PROVIDED IN RELATION TO THE ACCURACY, COMPLETENESS OR RELIABILITY OF THE INFORMATION CONTAINED HEREIN, NOR IS IT INTENDED TO BE A COMPLETE STATEMENT OR SUMMARY OF THE SECURITIES, MARKETS OR DEVELOPMENTS REFERRED TO IN THE REPORT. THE REPORT SHOULD NOT BE REGARDED BY RECIPIENTS AS A SUBSTITUTE FOR THE EXERCISE OF THEIR OWN JUDGMENT. ANY OPINIONS EXPRESSED IN THIS REPORT ARE SUBJECT TO CHANGE WITHOUT NOTICE. THE ANALYSIS CONTAINED HEREIN IS BASED ON NUMEROUS ASSUMPTIONS. DIFFERENT ASSUMPTIONS COULD RESULT IN MATERIALLY DIFFERENT RESULTS. THE ANALYST RESPONSIBLE FOR THE PREPARATION OF THIS REPORT MAY INTERACT WITH TRADING DESK PERSONNEL, SALES PERSONNEL, OTHER ANALYSTS, JOURNALISTS, AND OTHER CONSTITUENCIES FOR THE PURPOSE OF GATHERING, SYNTHESIZING AND INTERPRETING MARKET INFORMATION. METIS CAPITAL MANAGEMENT LLC IS UNDER NO OBLIGATION TO UPDATE OR KEEP CURRENT THE INFORMATION CONTAINED HEREIN. THE SECURITIES DESCRIBED HEREIN MAY NOT BE ELIGIBLE FOR SALE IN ALL JURISDICTIONS OR TO CERTAIN CATEGORIES OF INVESTORS. OPTIONS, DERIVATIVE PRODUCTS AND FUTURES ARE NOT SUITABLE FOR ALL INVESTORS, AND TRADING IN THESE INSTRUMENTS IS CONSIDERED RISKY. MORTGAGE AND ASSET-BACKED SECURITIES MAY INVOLVE A HIGH DEGREE OF RISK AND MAY BE HIGHLY VOLATILE IN RESPONSE TO FLUCTUATIONS IN INTEREST RATES AND OTHER MARKET CONDITIONS. PAST PERFORMANCE IS NOT NECESSARILY INDICATIVE OF FUTURE RESULTS. FOREIGN CURRENCY RATES OF EXCHANGE MAY ADVERSELY AFFECT THE VALUE, PRICE OR INCOME OF ANY SECURITY OR RELATED INSTRUMENT MENTIONED IN THIS REPORT. METIS CAPITAL MANAGEMENT LLC ACCEPTS NO LIABILITY FOR ANY LOSS OR DAMAGE ARISING OUT OF THE USE OF ALL OR ANY PART OF THIS REPORT. CERTAIN OF THE INFORMATION CONTAINED IN THIS PRESENTATION IS BASED UPON FORWARD-LOOKING STATEMENTS, INFORMATION AND OPINIONS, INCLUDING DESCRIPTIONS OF ANTICIPATED MARKET CHANGES AND EXPECTATIONS OF FUTURE ACTIVITY. METIS BELIEVES THAT SUCH STATEMENTS, INFORMATION, AND OPINIONS ARE BASED UPON REASONABLE ESTIMATES AND ASSUMPTIONS. HOWEVER, FORWARD-LOOKING STATEMENTS, INFORMATION AND OPINIONS ARE INHERENTLY UNCERTAIN AND ACTUAL EVENTS OR RESULTS MAY DIFFER MATERIALLY FROM THOSE REFLECTED IN THE FORWARD-LOOKING STATEMENTS. THEREFORE, UNDUE RELIANCE SHOULD NOT BE PLACED ON SUCH FORWARD-LOOKING STATEMENTS, INFORMATION AND OPINIONS.
Posted on 07/16/2026 at 09:12 AM

