Aug 13
Fixed Income/Mortgage Market Update
The following two charts represent the yield on 10- and 30-year U.S. treasury bonds.
Treasury bonds are used to price mortgage bonds. Thirty-year mortgage rates, around 6.8%, are still below the highs seen in 2023, meaning that the mortgage spread over treasuries has compressed substantially. But the trend in log term treasury and mortgage rates seems to be on the rise.
Today’s 30-year bond auction was somewhat weak, and demonstrated that investors are demanding substantial compensation to take on 30-year duration. The yield on the 30-year bond auction today was 5.216%.
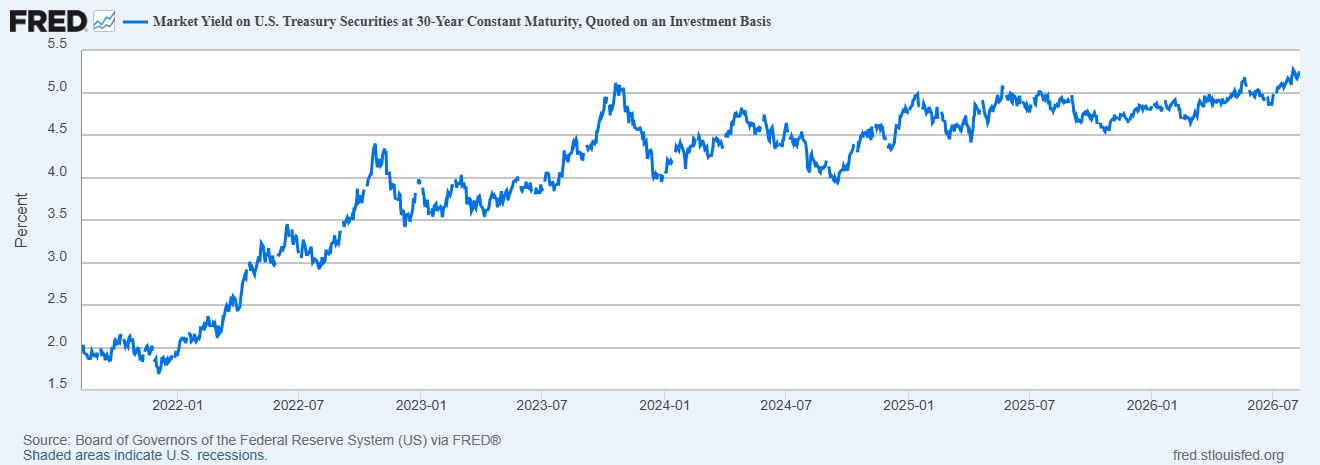
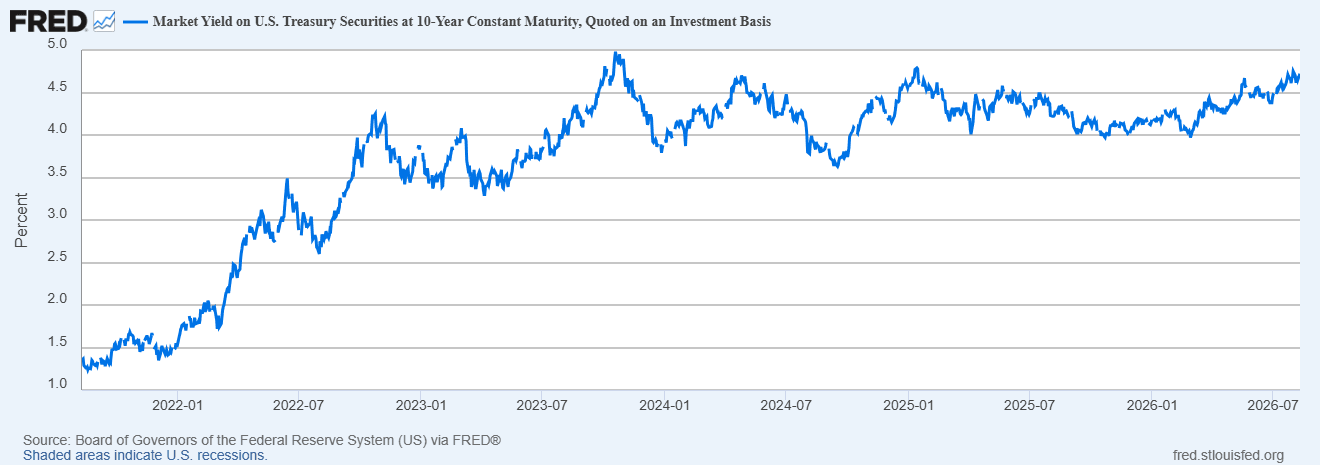
Long bond yields are rising because of term premiums, fiscal concerns, treasury supply, and inflation risk.However many economists believe that fiscal concerns are without doubt the largest contributor to higher bond yields.
I will attempt to elaborate on recent trends for each of these factors below:
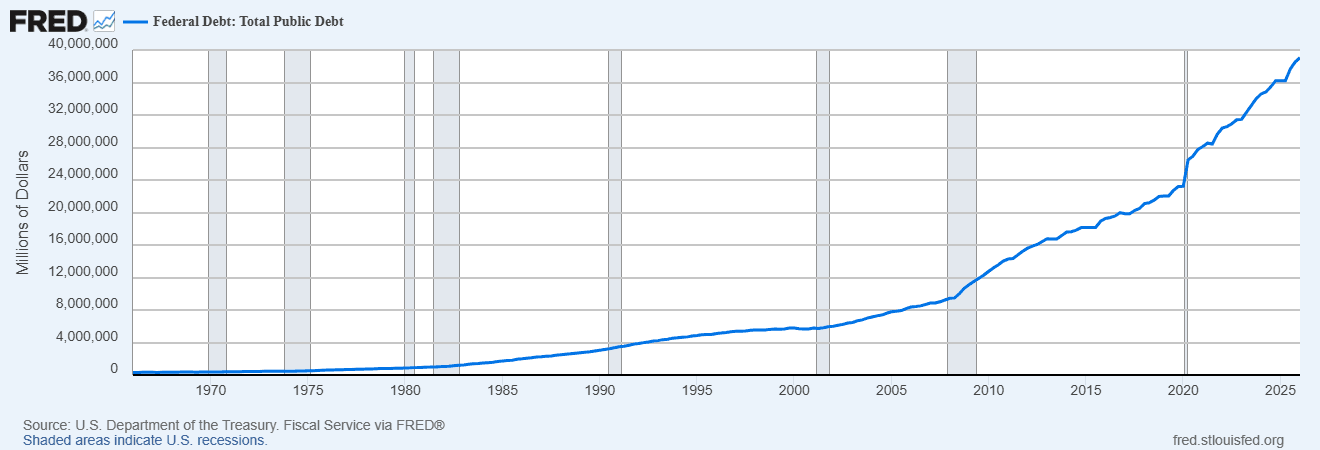
“Term premium” is the extra yield that investors demand for longer term loans, and in general, when the perception of credit quality worsens, the longer we lend money to a counterparty (in this case the U.S. government) the more we expect to be rewarded because longer loans carry more risk. As we approach $40 trillion of Federal debt, the fiscal situation of the U.S. government has deteriorated dramatically over the past ten years. In fact, as the chart below indicates, it has nearly doubled!
Total Federal Public debt:
But this is only one third the story. “Total federal public debt” does not include the government’s future entitlement obligations for Social Security, Medicare, Medicaid, and Veteran’s benefits. The present value of projected benefits for these programs MINUS the present value of revenues dedicated to them comes to $79.6 trillion. 1 We call that the “fiscal gap” That brings the actual national debt to around $119.6 trillion.
It’s well known that there is a longer-term funding gap for Social Security and Medicare. However, the cost of 25 years of “forever wars” has been pushing the cost of veteran’s benefits in an alarming way. 50 years ago, veteran’s benefits as a percentage of the defense budget were around 12% of defense spending. Now, they represent around 27%, or $400 billion of veterans’ benefits annually, which, in turn is 7.6% of the total federal tax receipts. This number is growing at 2-3 times what annual tax receipts are growing. You may hear in the financial press the word “entitlements”, which is a catch-all for Social Security, Medicare, Medicaid, and Veteran’s benefits. Use of that word for Social Security is somewhat ironic, since we’ve all contributed to it for most of our working lives!
Currently, interest payments on treasury bonds plus payouts on “entitlements” gobble over 100% of the $5.2 trillion that the government takes each year in tax receipts. It’s easy to see why some consider the national debt a tinder keg waiting to explode.
The US Debt-to-GDP Ratio (GDP)
We often hear this term in the financial press, which is nuanced. The term is used for the relative health of a country’s finances. Beyond a level of 100% is empirically shown to be “unhealthy.2. The U.S “makes” $32 trillion per year (GDP). The amount of treasury bond debt now stands at $40.2 trillion, approximately 125% of GDP.
If we strip out what certain US agencies (like Social Security) hold in treasury bonds, that number comes down to 101%. But neither of these numbers include the “fiscal gap” mentioned above. If we hypothetically treated the “fiscal gap” caused by entitlements and added it to today’s gross federal debt, the U.S. debt-to-GDP ratio would be 370% (!)
How to solve this problem? The U.S. government can raise taxes, but let’s face it, that’s not going to happen. They can cut “entitlements” too, but that would be political suicide. Or, they can print more electronic money to help finance these debts. The more money the Fed prints, the more inflation rises, and the more inflation rises, the higher bond yields go.
Treasury Supply
The next 12-18 months look like a difficult year for the supply of Treasury bonds. Over that period, approximately $11 trillion of short-term treasury bills will mature and need to be re-issued. Furthermore, $5 trillion of treasury notes and bonds will mature. Investors will have to absorb `$16 trillion is refinancing/rollovers, and then a whole new $3 trillion of net borrowing from new budget deficits, which is a huge number for an economy which is not in recession.
It used to be the case that the US government would, at least in theory, try to overspend in times of recession and run a surplus when times were good. Now, the Congressional budget office has signed, into law deficits totaling $2.4 trillion per year for the next ten years.
What is shaping up is a convergence of four different pressures on the bond market:
1) The “banalization” of huge deficits going forward for the next ten years.
2) Interest expense itself is increasing borrowing requirements. Last week, the U.S. Treasury announced that higher interest costs would cost them $120 billion more over the last year. This creates a negative feedback loop: More debt leads to more interest payments, which leads to a bigger deficit, which leads to more Treasury issuance, leading to more debt.
3) Foreign central banks aren’t absorbing Treasury issuance the way they used to (discussed below).
4) Foreign sovereigns are increasing their bond issuance, thus competing with Treasury bonds for creditors.
Foreign Selling of Treasury bonds:
Japanese bond yields are exploding higher. Why should a California real estate investor care?
Because Japan is the biggest foreign holder of Treasury bonds. Japan appears to be undergoing a portfolio shift away from US treasuries and toward European and Japanese government bonds.
One reason for this is that Japanese 30-year bond yields are now approaching 4%, putting them surprisingly close to US treasury yields without Japanese investors having to assume US dollar currency risk. For decades, Japanese investors sought higher yields in the US and bought US treasuries.
Now, Japan may be transitioning from a structural buyer of US treasuries into a neutral or even structural seller.
But Japan isn’t the only country considering selling U.S. treasury bonds to finance their own domestic needs, The second largest holder of U.S. treasury bonds is the UK, holding $949 billion of them. The UK, like Japan and Europe, intends to ramp up its military spending at a time when its own finances look moribund. 3 The same can be said for continental Europe, which needs enormous amounts of capital to enlarge its military. As Europe issues more European debt, European yields become more competitive, and global investors may allocate less capital to treasuries.
The trend has been in place for some time; foreign “official institutions” like central banks and sovereign wealth funds held 68% of foreign treasury holdings in 2015. That number is now 43%. Foreigners owned 46.8% of all marketable treasuries in 2015, but only 33.5% in 2025. US Treasury issuance is far outpacing foreign purchases, and, as mentioned above, certain countries may even represent selling pressure due to their own domestic needs.
Mortgage Spreads Over Treasury Bonds
At the moment, mortgage spreads are widening modestly. This is the spread between treasury bonds and mortgage rates. The current spread between the 30-year mortgage rate and the ten-yield treasury bond is around 207 basis points. Prior to the pandemic, it was between 150-175 basis points. There is a correlation between interest rate volatility and mortgage spreads. When interest rate volatility is low (as it is now, mortgage spreads tend to tighten. If interest rate volatility increases (perhaps due to a breakdown in the bond market), mortgage spreads tend to widen, making mortgage rates more expensive relative to treasuries. If heavy treasury issuance causes violent moves in the ten- and thirty-year treasury market, mortgage spreads could remain stubbornly wide or even increase.
-Grant Rogers, Metis Capital Management LLC
Reference:
1) Executive Summary to the FY 2025 Financial Report of the United States Government, Bureau of the Fiscal Service, U.S. Department of the Treasury, May 6, 2026
2) Reinhart, Carmen, and Kenneth Rogoff. 2010. “Growth in a Time of Debt”. American Economic Review 100 (2): 573-78.
3) Atlantic Magazine, How Britain Became as Poor as Mississippi, by Idrees Kahloon, June 10,2026
GLOBAL DISCLAIMER: THIS REPORT HAS BEEN PREPARED BY METIS CAPITAL MANAGEMENT LLC. THIS REPORT IS FOR DISTRIBUTION ONLY UNDER SUCH CIRCUMSTANCES AS MAY BE PERMITTED BY APPLICABLE LAW. IT HAS NO REGARD TO THE SPECIFIC INVESTMENT OBJECTIVES, FINANCIAL SITUATION OR PARTICULAR NEEDS OF ANY SPECIFIC RECIPIENT. IT IS PUBLISHED SOLELY FOR INFORMATIONAL PURPOSES AND IS NOT TO BE CONSTRUED AS A SOLICITATION OR AN OFFER TO BUY OR SELL ANY SECURITIES OR RELATED FINANCIAL INSTRUMENTS. NO REPRESENTATION OR WARRANTY, EITHER EXPRESS OR IMPLIED, IS PROVIDED IN RELATION TO THE ACCURACY, COMPLETENESS OR RELIABILITY OF THE INFORMATION CONTAINED HEREIN, NOR IS IT INTENDED TO BE A COMPLETE STATEMENT OR SUMMARY OF THE SECURITIES, MARKETS OR DEVELOPMENTS REFERRED TO IN THE REPORT. THE REPORT SHOULD NOT BE REGARDED BY RECIPIENTS AS A SUBSTITUTE FOR THE EXERCISE OF THEIR OWN JUDGMENT. ANY OPINIONS EXPRESSED IN THIS REPORT ARE SUBJECT TO CHANGE WITHOUT NOTICE. THE ANALYSIS CONTAINED HEREIN IS BASED ON NUMEROUS ASSUMPTIONS. DIFFERENT ASSUMPTIONS COULD RESULT IN MATERIALLY DIFFERENT RESULTS. THE ANALYST RESPONSIBLE FOR THE PREPARATION OF THIS REPORT MAY INTERACT WITH TRADING DESK PERSONNEL, SALES PERSONNEL, OTHER ANALYSTS, JOURNALISTS, AND OTHER CONSTITUENCIES FOR THE PURPOSE OF GATHERING, SYNTHESIZING AND INTERPRETING MARKET INFORMATION. METIS CAPITAL MANAGEMENT LLC IS UNDER NO OBLIGATION TO UPDATE OR KEEP CURRENT THE INFORMATION CONTAINED HEREIN. THE SECURITIES DESCRIBED HEREIN MAY NOT BE ELIGIBLE FOR SALE IN ALL JURISDICTIONS OR TO CERTAIN CATEGORIES OF INVESTORS. OPTIONS, DERIVATIVE PRODUCTS AND FUTURES ARE NOT SUITABLE FOR ALL INVESTORS, AND TRADING IN THESE INSTRUMENTS IS CONSIDERED RISKY. MORTGAGE AND ASSET-BACKED SECURITIES MAY INVOLVE A HIGH DEGREE OF RISK AND MAY BE HIGHLY VOLATILE IN RESPONSE TO FLUCTUATIONS IN INTEREST RATES AND OTHER MARKET CONDITIONS. PAST PERFORMANCE IS NOT NECESSARILY INDICATIVE OF FUTURE RESULTS. FOREIGN CURRENCY RATES OF EXCHANGE MAY ADVERSELY AFFECT THE VALUE, PRICE OR INCOME OF ANY SECURITY OR RELATED INSTRUMENT MENTIONED IN THIS REPORT. METIS CAPITAL MANAGEMENT LLC ACCEPTS NO LIABILITY FOR ANY LOSS OR DAMAGE ARISING OUT OF THE USE OF ALL OR ANY PART OF THIS REPORT. CERTAIN OF THE INFORMATION CONTAINED IN THIS PRESENTATION IS BASED UPON FORWARD-LOOKING STATEMENTS, INFORMATION AND OPINIONS, INCLUDING DESCRIPTIONS OF ANTICIPATED MARKET CHANGES AND EXPECTATIONS OF FUTURE ACTIVITY. METIS BELIEVES THAT SUCH STATEMENTS, INFORMATION, AND OPINIONS ARE BASED UPON REASONABLE ESTIMATES AND ASSUMPTIONS. HOWEVER, FORWARD-LOOKING STATEMENTS, INFORMATION AND OPINIONS ARE INHERENTLY UNCERTAIN AND ACTUAL EVENTS OR RESULTS MAY DIFFER MATERIALLY FROM THOSE REFLECTED IN THE FORWARD-LOOKING STATEMENTS. THEREFORE, UNDUE RELIANCE SHOULD NOT BE PLACED ON SUCH FORWARD-LOOKING STATEMENTS, INFORMATION AND OPINIONS.
Posted on 08/13/2026 at 11:23 AM

